Table recipes
Every cell kind and decoration has its own page in the gallery, one feature at a time. These recipes put several together into finished tables, the way reactable and reactablefmtr showcases do: league marks, colour scales, a theme and, where the table is long enough to need it, sorting, filtering and paging. Each one runs on the sample data.
NBA standings, sortable and filterable
Logos, a team-colour bar beside each nickname and the wins coloured by rank, for the 2023-24 Pacific Division. Click a header to sort or type a city into the filter box; games behind and win % are computed from the captured wins and losses.
 | Clippers | LA | 51 | 31 | 62.2% | 0.0 |
 | Suns | Phoenix | 49 | 33 | 59.8% | 2.0 |
 | Lakers | Los Angeles | 47 | 35 | 57.3% | 4.0 |
 | Kings | Sacramento | 46 | 36 | 56.1% | 5.0 |
 | Warriors | Golden State | 46 | 36 | 56.1% | 5.0 |
| Source: stats.nba.com leaguestandingsv3 | ||||||
import { NBA_STANDINGS } from "@sportsdataverse/examples/data";
import { createTable, defineTable } from "@sportsdataverse/sdvtables";
import { hydrate, prepare, renderHTML } from "@sportsdataverse/sdvtables/html";

// The Pacific Division, 2023-24: games behind the leader and win % are derived from the captured wins and losses.
const lead = NBA_STANDINGS[0];
const rows = NBA_STANDINGS.map((r) => ({
  logo: r.team,
  team: r.team,
  city: r.city,
  wins: r.wins,
  losses: r.losses,
  win_pct: r.wins / (r.wins + r.losses),
  gb: lead ? (lead.wins - r.wins + (r.losses - lead.losses)) / 2 : 0,
}));
const spec = defineTable<(typeof rows)[number]>()
  .columns((c) => [
    c.logo("logo", { league: "nba", label: "", sortable: false }),
    c.teamColorBar("team", { league: "nba", label: "Team", barWidth: 6 }),
    c.text("city", { filterable: true }),
    c.colorRanks("wins", { label: "W" }),
    c.int("losses", { label: "L" }),
    c.pct("win_pct", { label: "Win %" }),
    c.num("gb", { label: "GB", digits: 1 }),
  ])
  .title("Pacific Division")
  .subtitle("2023-24 NBA regular season, final")
  .sourceNote("Source: stats.nba.com leaguestandingsv3")
  .theme("athletic")
  .rowKey("team")
  .build();
await prepare(spec);
// click a header to sort, type in the City box to filter
const table = createTable(spec, rows, { sort: { col: "win_pct", dir: "desc" } });
const host = document.createElement("div");
host.innerHTML = renderHTML(table);
hydrate(host.querySelector(".sdvt") as Element, table);
host;
NHL standings, grouped
The Atlantic Division split into the top three, who qualify for the playoffs, and everyone else. groupBy and
groupStripes mark the two groups, tally writes the record and percentileBar places each team's points percentage
on a track.
| Team | W-L-OT | Pts | Points % | |
|---|---|---|---|---|
| Top three: a playoff berth | ||||
| 1st |  BUF | 50-23-9 | 109 | |
| 2nd |  TBL | 50-26-6 | 106 | |
| 3rd |  MTL | 48-24-10 | 106 | |
| Wild-card race and out | ||||
| 4th |  BOS | 45-27-10 | 100 | |
| 5th |  OTT | 44-27-11 | 99 | |
| 6th |  DET | 41-31-10 | 92 | |
| 7th |  FLA | 40-38-4 | 84 | |
| 8th |  TOR | 32-36-14 | 78 | |
| Source: NHL api-web /v1/standings/now | ||||
import { NHL_STANDINGS } from "@sportsdataverse/examples/data";
import { defineTable } from "@sportsdataverse/sdvtables";
import { renderHTMLAsync } from "@sportsdataverse/sdvtables/html";

// The top three of each division qualify for the playoffs; everyone else is grouped below them.
const rows = NHL_STANDINGS.map((r) => ({
  ...r,
  group: r.division_rank <= 3 ? "Top three: a playoff berth" : "Wild-card race and out",
  points_pct: r.points / ((r.wins + r.losses + r.ot_losses) * 2),
}));
const spec = defineTable<(typeof rows)[number]>()
  .columns((c) => [
    c.rank("division_rank", { label: "" }),
    c.logo("team", { league: "nhl", includeName: true, label: "Team" }),
    c.tally(["wins", "losses", "ot_losses"], { label: "W-L-OT" }),
    c.int("points", { label: "Pts" }),
    c.percentileBar("points_pct", { label: "Points %", domain: [0, 100], decimals: 1 }),
  ])
  .groupBy("group")
  .groupStripes({ color: "#EEF3FA", start: 1 })
  .titleHeader("Atlantic Division", { kicker: "NHL 2025-26", subtitle: "Final regular-season standings" })
  .sourceNote("Source: NHL api-web /v1/standings/now")
  .theme("swiss")
  .build();
await renderHTMLAsync(spec, rows);
NFL EPA per play, paged
All 32 teams, eight to a page, with logos and wordmarks. Offence and defence share one colour scale, so one legend
reads for both, and delta shows the net with an arrow.
| Net | ||||
|---|---|---|---|---|
 |  | 0.197 | 0.018 | ▲ 0.215 |
 |  | 0.187 | 0.003 | ▲ 0.190 |
 |  | 0.155 | 0.045 | ▲ 0.200 |
 |  | 0.139 | -0.043 | ▲ 0.096 |
 |  | 0.132 | -0.017 | ▲ 0.115 |
 |  | 0.111 | 0.086 | ▲ 0.196 |
 |  | 0.106 | -0.055 | ▲ 0.052 |
 |  | 0.080 | 0.068 | ▲ 0.148 |
| Source: nflverse play_by_play_2024 | ||||
import { NFL_TEAM_EPA_2024 } from "@sportsdataverse/examples/data";
import { createTable, defineTable } from "@sportsdataverse/sdvtables";
import { hydrate, prepare, renderHTML } from "@sportsdataverse/sdvtables/html";

// EPA per play from the season totals. A defence's EPA allowed is flipped in sign (EPA saved), so higher is better in
// both pill columns and one legend reads for both; net = offence minus EPA allowed.
const rows = NFL_TEAM_EPA_2024.map((r) => ({
  logo: r.team,
  team: r.team,
  off: r.off_epa / r.off_plays,
  saved: -r.def_epa / r.def_plays,
  // delta(from, to) shows to - from under the key `from`, so the net column reads EPA allowed under its own key
  net: r.def_epa / r.def_plays,
}));
const spec = defineTable<(typeof rows)[number]>()
  .columns((c) => [
    c.logo("logo", { league: "nfl", label: "", sortable: false }),
    c.wordmark("team", { league: "nfl", label: "Team", filterable: true }),
    c.colorPills("off", { label: "Offence", digits: 3, domain: [-0.25, 0.25] }),
    c.colorPills("saved", { label: "Defence", digits: 3, domain: [-0.25, 0.25] }),
    c.delta("net", "off", { label: "Net", decimals: 3, arrows: true, sortable: false }), // its key holds EPA allowed, so sorting it would sort by defence
  ])
  .legendContinuous({ title: "EPA per play", digits: 2 })
  .titleHeader("Who moved the ball, and who stopped it", {
    kicker: "NFL 2024",
    subtitle: "Expected points added per rush or pass play, regular season",
  })
  .sourceNote("Source: nflverse play_by_play_2024")
  .theme("sdv")
  .rowKey("team")
  .build();
await prepare(spec);
// eight teams a page, the best offence first; sort any column, filter by team
const table = createTable(spec, rows, { pageSize: 8, sort: { col: "off", dir: "desc" } });
const host = document.createElement("div");
host.innerHTML = renderHTML(table);
hydrate(host.querySelector(".sdvt") as Element, table);
host;
A game log in the team's colours
The sdvTeam theme takes its heading colour from the team named in its options. Here it frames Philadelphia's 2024
regular season: opponent logos, results, scores and margins, six games to a page.
| Margin | |||||
|---|---|---|---|---|---|
| 1 | GB | Home | W | 34-29 | +5 |
| 2 |  ATL | Home | L | 21-22 | −1 |
| 3 |  NO | Away | W | 15-12 | +3 |
| 4 | TB | Away | L | 16-33 | −17 |
| 6 |  CLE | Home | W | 20-16 | +4 |
| 7 |  NYG | Away | W | 28-3 | +25 |
| Source: nflverse games | |||||
import { KC_PHI_GAMES_2024 } from "@sportsdataverse/examples/data";
import { createTable, defineTable } from "@sportsdataverse/sdvtables";
import { hydrate, prepare, renderHTML } from "@sportsdataverse/sdvtables/html";

// Philadelphia's 17 regular-season games, from its side: the opponent, home or away, and the score.
const rows = KC_PHI_GAMES_2024.filter((g) => g.home_team === "PHI" || g.away_team === "PHI").map((g) => {
  const home = g.home_team === "PHI";
  const phi = home ? g.home_score : g.away_score;
  const opp = home ? g.away_score : g.home_score;
  return {
    week: g.week,
    opponent: home ? g.away_team : g.home_team,
    site: home ? "Home" : "Away",
    phi,
    opp,
    result: phi > opp ? "W" : phi < opp ? "L" : "T",
  };
});
const spec = defineTable<(typeof rows)[number]>()
  .columns((c) => [
    c.int("week", { label: "Wk" }),
    c.logo("opponent", { league: "nfl", includeName: true, label: "Opponent", filterable: true }),
    c.text("site", { label: "", filterable: true }),
    c.colorResults("result", { label: "" }),
    c.tally(["phi", "opp"], { label: "Score" }),
    c.delta("opp", "phi", { label: "Margin", decimals: 0, sortable: false }), // its key holds the opponent's points, not the margin
  ])
  .title("Philadelphia Eagles, 2024")
  .subtitle("Regular season: 14-3, then a Super Bowl win over Kansas City")
  .sourceNote("Source: nflverse games")
  // sdvTeam: the heading in the team's primary colour, labels in a readable one
  .theme("sdvTeam", { options: { league: "nfl", team: "PHI" } })
  .build();
await prepare(spec);
const table = createTable(spec, rows, { pageSize: 6, sort: { col: "week", dir: "asc" } });
const host = document.createElement("div");
host.innerHTML = renderHTML(table);
hydrate(host.querySelector(".sdvt") as Element, table);
host;
Quarterbacks on a dark theme
midnight is a dark theme. The table shows ESPN headshots, each quarterback's name above his team in the team colour, and a
missing value shown as an empty pill. rowAccent turns the division into a coloured left edge and spotlight lights
Buffalo and dims the rest.
 | Josh Allen
BUF | 13-4 | 4th | 0.190 | L |
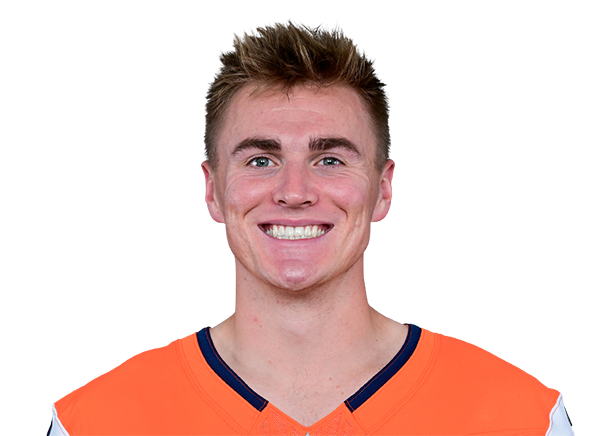 | Bo Nix
DEN | 10-7 | 8th | 0.108 | W |
 | Justin Herbert
LAC | 11-6 | 9th | 0.101 | W |
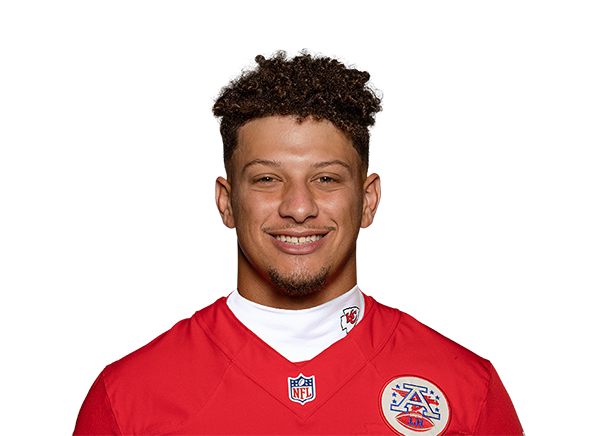 | Patrick Mahomes
KC | 15-2 | 10th | 0.063 | L |
 | Tua Tagovailoa
MIA | 8-9 | 21st | -0.019 | L |
 | Aaron Rodgers
NYJ | 5-12 | 24th | -0.045 | W |
 | Gardner Minshew
LV | 4-13 | 26th | -0.146 | L |
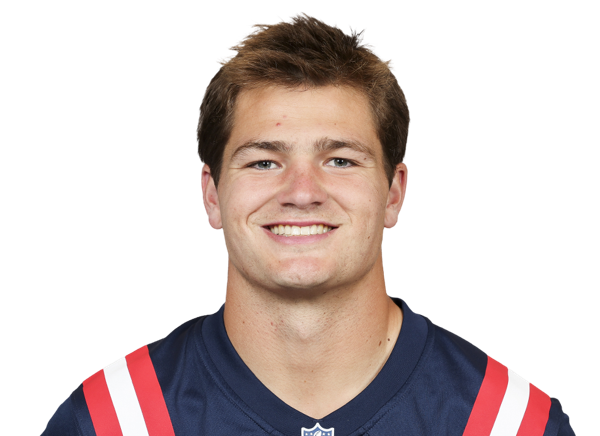 | Drake Maye
NE | 4-13 | 29th | W | |
| Source: nflverse games, players and play_by_play_2024. New England's net EPA is blanked in the sample data. | |||||
import { STANDINGS, type Standing } from "@sportsdataverse/examples/data";
import { createTable, defineTable } from "@sportsdataverse/sdvtables";
import { hydrate, prepare, renderHTML } from "@sportsdataverse/sdvtables/html";

const spec = defineTable<Standing>()
  .columns((c) => [
    c.headshot("qb_espn_id", { league: "nfl", label: "", sortable: false }),
    // color: the top line, black by default, in midnight's text colour
    c.mergeStackTeamColor("qb", "team", "team", { league: "nfl", label: "Quarterback", color: "#E8E9ED" }),
    c.text("division"),
    c.tally(["wins", "losses"], { label: "W-L" }),
    c.rank("srs_rank", { label: "SRS rank" }),
    c.colorPills("net_epa", { label: "Net EPA/play", digits: 3, domain: [-0.2, 0.2], naColor: "#3A3D45" }),
    c.text("result_last", { label: "Week 18", align: "center" }),
  ])
  // the division column becomes a coloured left edge (and is hidden); Buffalo is lit, the rest dimmed
  .rowAccent("division", { palette: { East: "#5B8DEF", West: "#E8A33D" }, width: 5 })
  .spotlight({ key: "team", op: "==", value: "BUF" }, { accentColor: "#C60C30" })
  .titleHeader("Josh Allen's Bills, and the rest of the AFC East and West", {
    kicker: "NFL 2024",
    subtitle:
      "Starting quarterback, record, league-wide SRS rank and net EPA per play; East rows edged blue, West amber",
  })
  .sourceNote(
    "Source: nflverse games, players and play_by_play_2024. New England's net EPA is blanked in the sample data.",
  )
  .theme("midnight")
  .rowKey("team")
  .build();
await prepare(spec);
const table = createTable(spec, STANDINGS, { sort: { col: "srs_rank", dir: "asc" } });
const host = document.createElement("div");
host.innerHTML = renderHTML(table);
hydrate(host.querySelector(".sdvt") as Element, table);
host;
A hockey scoring summary
The four goals of the PWHL's game 42, with team logos looked up by HockeyTech id, each scorer above the team name in
its colour, and the score after each goal. A cutline marks the end of each period but the last.
| Per. | Time | Scored by | BOS-MTL | |
|---|---|---|---|---|
| 1 | 3:51 |  | Marie-Philip Poulin
PWHL Montreal | 0-1 |
| 2 | 4:50 | | Mélodie Daoust
PWHL Montreal | 0-2 |
| 2 | 14:55 |  | Hilary Knight
PWHL Boston | 1-2 |
| 3 | 2:29 | | Erin Ambrose
PWHL Montreal | 1-3 |
| Source: HockeyTech gameCenterPlayByPlay, game 42 | ||||
import { PWHL_GOALS } from "@sportsdataverse/examples/data";
import { defineTable } from "@sportsdataverse/sdvtables";
import { renderHTMLAsync } from "@sportsdataverse/sdvtables/html";

// The feed's abbreviations as HockeyTech team ids (what sdvplot's pwhl data keys on), and as 2024 team names.
const HOCKEYTECH_ID = { BOS: "1", MTL: "3" } as const;
const NAME_2024 = { BOS: "PWHL Boston", MTL: "PWHL Montreal" } as const;
// the running score after each goal, from the goals themselves (Boston away, Montreal at home)
let bos = 0;
let mtl = 0;
const rows = PWHL_GOALS.map((g) => {
  if (g.team === "MTL") mtl++;
  else bos++;
  return {
    period: g.period,
    time: g.time,
    team_id: HOCKEYTECH_ID[g.team],
    team_name: NAME_2024[g.team],
    scorer: g.scorer,
    score: `${bos}-${mtl}`,
  };
});
// a dashed line under the last goal of each period but the last
const ends = rows.flatMap((r, i) => (i < rows.length - 1 && r.period !== rows[i + 1]?.period ? [i + 1] : []));
const spec = defineTable<(typeof rows)[number]>()
  .columns((c) => [
    c.int("period", { label: "Per." }),
    c.text("time", { label: "Time" }),
    c.logo("team_id", { league: "pwhl", idSystem: "hockeytech", label: "" }),
    c.mergeStackTeamColor("scorer", "team_name", "team_id", {
      league: "pwhl",
      idSystem: "hockeytech",
      label: "Scored by",
    }),
    c.text("score", { label: "BOS-MTL", align: "center" }),
  ])
  .cutline(ends, { label: ends.map((n) => `End of period ${rows[n - 1]?.period}`), color: "#555555" })
  .titleHeader("Montreal 3, Boston 1", { kicker: "PWHL, 2 March 2024", subtitle: "Every goal, in order" })
  .sourceNote("Source: HockeyTech gameCenterPlayByPlay, game 42")
  .theme("scoreboard")
  .build();
await renderHTMLAsync(spec, rows);
World Cup passing
France's completed first-half passes in the 2018 final, one row per passer: mean length, metres gained toward goal as colour pills, and the share that ended in the attacking third as a percentile bar. The table is sortable and pages six passers at a time. Passers are shown by StatsBomb player id: the fixture carries no names.
| 1st | 5485 | 14 | 24.3 m | 16 | |
| 2nd | 4375 | 11 | 13.4 m | -8 | |
| 3rd | 5492 | 9 | 20.9 m | 73 | |
| 4th | 3961 | 7 | 11.3 m | -10 | |
| 5th | 20004 | 7 | 23.7 m | 32 | |
| 6th | 5487 | 6 | 16.8 m | -13 | |
| Data: StatsBomb open data (match 8658), as socceraction SPADL | |||||
 Data: StatsBomb open data
import { WC2018_FINAL_FRANCE_PASSES } from "@sportsdataverse/examples/data";
import { createTable, defineTable } from "@sportsdataverse/sdvtables";
import { hydrate, renderHTML } from "@sportsdataverse/sdvtables/html";

// One row per passer (StatsBomb player id): completed passes, their mean length, metres gained toward goal and the
// share that ended in the attacking third (x beyond 70 of the 105 m pitch, France attacking left to right).
const byPlayer = new Map<number, (typeof WC2018_FINAL_FRANCE_PASSES)[number][]>();
for (const p of WC2018_FINAL_FRANCE_PASSES)
  byPlayer.set(p.player_id, [...(byPlayer.get(p.player_id) ?? []), p]);
const rows = [...byPlayer].map(([player_id, passes]) => {
  const n = passes.length;
  return {
    player_id: String(player_id),
    passes: n,
    length: passes.reduce((s, p) => s + Math.hypot(p.end_x - p.start_x, p.end_y - p.start_y), 0) / n,
    gained: passes.reduce((s, p) => s + (p.end_x - p.start_x), 0),
    final_third: passes.filter((p) => p.end_x > 70).length / n,
    order: 0,
  };
});
rows
  .sort((a, b) => b.passes - a.passes)
  .forEach((r, i) => {
    r.order = i + 1;
  });
const spec = defineTable<(typeof rows)[number]>()
  .columns((c) => [
    c.rank("order", { label: "" }),
    c.text("player_id", { label: "Player id", filterable: true }),
    c.int("passes", { label: "Passes" }),
    c.num("length", { label: "Avg length", digits: 1, suffix: " m" }),
    c.colorPills("gained", {
      label: "Metres gained",
      digits: 0,
      palette: ["#B2182B", "#F7F7F7", "#1B7837"],
      domain: [-200, 200],
    }),
    c.percentileBar("final_third", { label: "Into the final third", domain: [0, 100], decimals: 0 }),
  ])
  .titleHeader("France's first-half passing", {
    kicker: "2018 World Cup final",
    subtitle: "Completed passes against Croatia, by passer",
  })
  .sourceNote("Data: StatsBomb open data (match 8658), as socceraction SPADL")
  .theme("sofa")
  .rowKey("player_id")
  .build();
const table = createTable(spec, rows, { pageSize: 6 });
const host = document.createElement("div");
host.innerHTML = renderHTML(table);
hydrate(host.querySelector(".sdvt") as Element, table);
host;