Table formatters
reactablefmtr gives R's reactable tables data bars, icon sets, bubbles and
colour tiles, and draws sparklines, sparkbars and gauges in cells. sdvtables has the same formatters as column kinds and options, with reactablefmtr's defaults, and adds
team awareness: where reactablefmtr reads a colour column (fill_color_ref, color_ref), sdvtables also takes a team
column and a league and paints each row in its team's colour, with the text kept readable. Everything is inline HTML
and SVG, so a table needs no icon font, tooltip library or script. Every example uses the eight 2024 AFC teams of the
sample data; the gallery is searchable by the reactablefmtr name (data_bars, icon_sets, ...).
Data bars
dataBar (reactablefmtr data_bars) draws a bar whose length is the value over the column's largest absolute value,
or the value scaled between minValue and maxValue. One fill colour paints every bar and several ramp over the
column's range (bias as in grDevices::colorRamp); gradient paints each bar left to right instead. colorRef reads a
colour column, or team and league use each team's colour, and mark: "logo" (or "wordmark", or "headshot"
with markKey) puts the team's mark at the end of the bar. textPosition is one of inside-end (the default),
inside-base, center, outside-end, outside-base, above and none; align: "right" grows the bars from the
right, and roundEdges, barHeight and numberFormat finish them.
| Team | Wins |
|---|---|
| KC | 15  |
| LAC | 11  |
| DEN | 10  |
| LV | 4  |
| BUF | 13  |
| MIA | 8  |
| NYJ | 5  |
| NE | 4  |
import { STANDINGS, type Standing } from "@sportsdataverse/examples/data";
import { defineTable } from "@sportsdataverse/sdvtables";
import { renderHTMLAsync } from "@sportsdataverse/sdvtables/html";

// reactablefmtr data_bars: the bar's length is wins over the most wins; team + league fill it in the team's colour
// (colorRef would read a colour column instead), and the value sits inside the bar's end in black or white.
const spec = defineTable<Standing>()
  .columns((c) => [
    c.text("team"),
    c.dataBar("wins", {
      label: "Wins",
      team: "team",
      league: "nfl",
      mark: "logo",
      roundEdges: true,
      width: "260px",
    }),
  ])
  .title("AFC, 2024")
  .build();
await renderHTMLAsync(spec, STANDINGS);
Diverging data bars
A column with a negative value (or posNeg: true) draws its bars either side of a centre line. Given two fill colours,
the first paints the negatives and the second the positives. A missing value stays blank.
| Team | Net EPA/play |
|---|---|
| KC | |
| LAC | |
| DEN | |
| LV | |
| BUF | |
| MIA | |
| NYJ | |
| NE |
import { STANDINGS, type Standing } from "@sportsdataverse/examples/data";
import { defineTable } from "@sportsdataverse/sdvtables";
import { renderHTMLAsync } from "@sportsdataverse/sdvtables/html";

// A column with a negative value draws its bars either side of a centre line; with two fill colours the first paints
// the negatives. New England's missing net EPA stays blank.
const spec = defineTable<Standing>()
  .columns((c) => [
    c.text("team"),
    c.dataBar("net_epa", {
      label: "Net EPA/play",
      fill: ["#C84630", "#5DA271"],
      textPosition: "outside-end",
      numberFormat: { digits: 3 },
      width: "260px",
    }),
  ])
  .title("AFC, 2024")
  .build();
await renderHTMLAsync(spec, STANDINGS);
Icon sets
iconSet (reactablefmtr icon_sets) puts an icon beside each value. The icons and the colours are each dealt out in
equal-count buckets of the column (dplyr::ntile), so with three colours the bottom third takes the first. The icon goes
to the right (the default), left, above, below or over the value.
| Team | Points for |
|---|---|
| KC | 385 |
| LAC | 402 |
| DEN | 425 |
| LV | 309 |
| BUF | 525 |
| MIA | 345 |
| NYJ | 338 |
| NE | 289 |
import { STANDINGS, type Standing } from "@sportsdataverse/examples/data";
import { defineTable } from "@sportsdataverse/sdvtables";
import { renderHTMLAsync } from "@sportsdataverse/sdvtables/html";

// reactablefmtr icon_sets: icons and colours are each dealt out in equal-count buckets (dplyr::ntile), so the bottom
// third of points scored gets the first icon and colour. The icons are inline SVG, not an icon font.
const spec = defineTable<Standing>()
  .columns((c) => [
    c.text("team"),
    c.iconSet("pf", {
      label: "Points for",
      icons: ["arrow-down", "minus", "arrow-up"],
      colors: ["#C84630", "#9A9A9A", "#5DA271"],
    }),
  ])
  .title("AFC, 2024")
  .build();
await renderHTMLAsync(spec, STANDINGS);
Icons per row
iconRef and iconColorRef read each row's icon and colour from columns instead of the buckets. ICON_NAMES (from
@sportsdataverse/sdvtables/html) lists every icon; they are plain SVG paths drawn for sdvtables, not Font Awesome.
| Name | Icon |
|---|---|
| circle | 0 |
| square | 1 |
| diamond | 2 |
| star | 3 |
| triangle-up | 4 |
| triangle-down | 5 |
| arrow-up | 6 |
| arrow-down | 7 |
| arrow-right | 8 |
| check | 9 |
| xmark | 10 |
| minus | 11 |
| plus | 12 |
| heart | 13 |
import { defineTable } from "@sportsdataverse/sdvtables";
import { ICON_NAMES, renderHTMLAsync } from "@sportsdataverse/sdvtables/html";

// ICON_NAMES lists the inline-SVG icons iconSet and iconAssign draw. iconRef reads each row's icon from a column, and
// iconPosition "over" shows the icon alone.
const icons = ICON_NAMES.map((name, i) => ({ name, i }));
const spec = defineTable<(typeof icons)[number]>()
  .columns((c) => [
    c.text("name", { label: "Name" }),
    c.iconSet("i", {
      label: "Icon",
      iconRef: "name",
      iconPosition: "over",
      colors: ["#15607A"],
      iconSize: 20,
    }),
  ])
  .build();
await renderHTMLAsync(spec, icons);
Icon assign
iconAssign (reactablefmtr icon_assign) writes a value as a row of icons: one per unit up to the column's maximum,
filled up to the value, or with buckets the value's bucket out of that many. showValues adds the number to the
left, right, above or below.
| Team | Wins |
|---|---|
| KC | 15 |
| LAC | 11 |
| DEN | 10 |
| LV | 4 |
| BUF | 13 |
| MIA | 8 |
| NYJ | 5 |
| NE | 4 |
import { STANDINGS, type Standing } from "@sportsdataverse/examples/data";
import { defineTable } from "@sportsdataverse/sdvtables";
import { renderHTMLAsync } from "@sportsdataverse/sdvtables/html";

// reactablefmtr icon_assign with buckets: each team's wins as its fifth of the column, out of five stars.
const spec = defineTable<Standing>()
  .columns((c) => [
    c.text("team"),
    c.iconAssign("wins", { label: "Wins", buckets: 5, icon: "star", fill: "#D6AF36", showValues: "right" }),
  ])
  .title("AFC, 2024")
  .build();
await renderHTMLAsync(spec, STANDINGS);
Merged columns
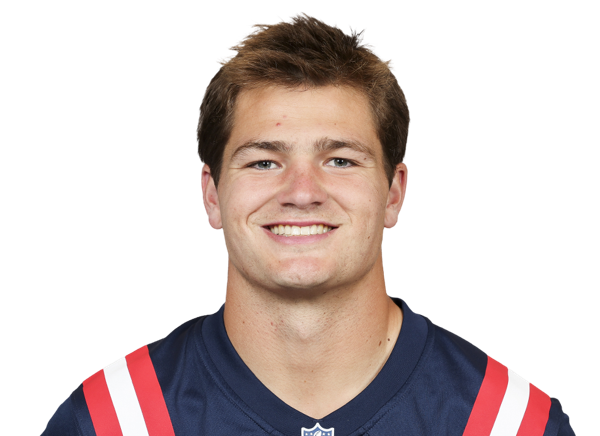
mergeStack (reactablefmtr merge_column) shows a second column's value beside the cell's own (position: right,
left, above or below), each with its own size, colour, weight and style. Like a data bar, it can lead with a
logo, wordmark or headshot. mergeStackTeamColor remains for a lower line in the team's colour.
| Quarterback | Wins |
|---|---|
 Patrick Mahomes West | 15 |
 Justin Herbert West | 11 |
 Bo Nix West | 10 |
 Gardner Minshew West | 4 |
 Josh Allen East | 13 |
 Tua Tagovailoa East | 8 |
 Aaron Rodgers East | 5 |
 Drake Maye East | 4 |
import { STANDINGS, type Standing } from "@sportsdataverse/examples/data";
import { defineTable } from "@sportsdataverse/sdvtables";
import { renderHTMLAsync } from "@sportsdataverse/sdvtables/html";

// reactablefmtr merge_column: the quarterback with his division below, each in its own size, colour and weight.
const spec = defineTable<Standing>()
  .columns((c) => [
    c.mergeStack("qb", "division", {
      label: "Quarterback",
      position: "below",
      mark: "headshot",
      markKey: "qb_espn_id",
      league: "nfl",
      markHeight: 32,
    }),
    c.int("wins"),
  ])
  .title("AFC, 2024")
  .build();
await renderHTMLAsync(spec, STANDINGS);
Bubbles
bubble (reactablefmtr bubble_grid) draws a circle, or with shape: "squares" a square, whose width is the value
over the column's largest, coloured on a ramp of the column's range or by colorRef / team. reactablefmtr's largest
bubble is 100 pixels; maxSize changes it.
| Team | Points for | Points against |
|---|---|---|
| KC | 385 | 326 |
| LAC | 402 | 301 |
| DEN | 425 | 311 |
| LV | 309 | 434 |
| BUF | 525 | 368 |
| MIA | 345 | 364 |
| NYJ | 338 | 404 |
| NE | 289 | 417 |
import { STANDINGS, type Standing } from "@sportsdataverse/examples/data";
import { defineTable } from "@sportsdataverse/sdvtables";
import { renderHTMLAsync } from "@sportsdataverse/sdvtables/html";

// reactablefmtr bubble_grid: the circle's width is the value over the column's largest, its colour a ramp over the
// column's range. maxSize shrinks reactablefmtr's 100px to fit a row.
const spec = defineTable<Standing>()
  .columns((c) => [
    c.text("team"),
    c.bubble("pf", { label: "Points for", maxSize: 44 }),
    c.bubble("pa", { label: "Points against", maxSize: 44, colors: ["#FA8C00", "#FFFFFF", "#15607A"] }),
  ])
  .title("AFC, 2024")
  .build();
await renderHTMLAsync(spec, STANDINGS);
Colour tiles and scales
colorRanks fills the cell, as reactablefmtr's color_scales and color_tiles do, and takes their options. span
puts several columns on one scale (true: every numeric column), bias moves the palette's stops, evenBreaks deals
the palette out in equal-count buckets instead of a ramp, showText: false keeps only the colour, and colorRef or
team gives a row its own fill.
| Team | PF | PA | SRS rank | Wins |
|---|---|---|---|---|
| KC | 385 | 326 | 10 | 15 |
| LAC | 402 | 301 | 9 | 11 |
| DEN | 425 | 311 | 8 | 10 |
| LV | 309 | 434 | 26 | 4 |
| BUF | 525 | 368 | 4 | 13 |
| MIA | 345 | 364 | 21 | 8 |
| NYJ | 338 | 404 | 24 | 5 |
| NE | 289 | 417 | 29 | 4 |
import { STANDINGS, type Standing } from "@sportsdataverse/examples/data";
import { defineTable } from "@sportsdataverse/sdvtables";
import { renderHTMLAsync } from "@sportsdataverse/sdvtables/html";

// span puts points for and against on one scale; bias spreads the high end; evenBreaks deals the palette out in
// equal-count buckets; showText: false keeps only the colour.
const spec = defineTable<Standing>()
  .columns((c) => [
    c.text("team"),
    c.colorRanks("pf", { label: "PF", span: ["pf", "pa"], bias: 1.5, palette: ["#FFFFFF", "#15607A"] }),
    c.colorRanks("pa", { label: "PA", span: ["pf", "pa"], bias: 1.5, palette: ["#FFFFFF", "#15607A"] }),
    c.colorRanks("srs_rank", { label: "SRS rank", evenBreaks: true }),
    c.colorRanks("wins", { label: "Wins", showText: false, reverse: true }),
  ])
  .title("AFC, 2024")
  .build();
await renderHTMLAsync(spec, STANDINGS);
Pill buttons in team colours
colorPills with colorRef, or team and league, colours each pill by its row (reactablefmtr pill_buttons with
color_ref); the text turns black or white to stay readable.
| Team | Wins |
|---|---|
| KC | 15 |
| LAC | 11 |
| DEN | 10 |
| LV | 4 |
| BUF | 13 |
| MIA | 8 |
| NYJ | 5 |
| NE | 4 |
import { STANDINGS, type Standing } from "@sportsdataverse/examples/data";
import { defineTable } from "@sportsdataverse/sdvtables";
import { renderHTMLAsync } from "@sportsdataverse/sdvtables/html";

// reactablefmtr pill_buttons(color_ref): team + league (or colorRef, a colour column) give each row its own pill
// colour; the text turns black or white to stay readable.
const spec = defineTable<Standing>()
  .columns((c) => [
    c.text("team"),
    c.colorPills("wins", { label: "Wins", team: "team", league: "nfl", domain: [0, 17], digits: 0 }),
  ])
  .title("AFC, 2024")
  .build();
await renderHTMLAsync(spec, STANDINGS);
Highlighting the minimum and maximum
highlight takes "min", "max" or "both" in place of a predicate (reactablefmtr highlight_min,
highlight_max and highlight_min_max): the extremes, every tie included, turn bold, the minimum red and the maximum
green. textColor and fill change the colours.
| Team | Wins | Points for |
|---|---|---|
| KC | 15 | 385 |
| LAC | 11 | 402 |
| DEN | 10 | 425 |
| LV | 4 | 309 |
| BUF | 13 | 525 |
| MIA | 8 | 345 |
| NYJ | 5 | 338 |
| NE | 4 | 289 |
import { STANDINGS, type Standing } from "@sportsdataverse/examples/data";
import { defineTable } from "@sportsdataverse/sdvtables";
import { renderHTMLAsync } from "@sportsdataverse/sdvtables/html";

// "both" marks the lowest value in red and the highest in green, bold, every tie included; "min" or "max" marks one.
const spec = defineTable<Standing>()
  .columns((c) => [
    c.text("team"),
    c.highlight("wins", "both", { label: "Wins" }),
    c.highlight("pf", "max", { label: "Points for", fill: "#FFF3B0", textColor: "#000000" }),
  ])
  .title("AFC, 2024")
  .build();
await renderHTMLAsync(spec, STANDINGS);
Tooltips
tooltip: true on any column writes the cell's value as its title attribute, which the browser shows on hover. It
needs no tooltip library; a cell that shows only an image takes the raw value.
| Team | Net EPA/play |
|---|---|
| KC | |
| LAC | |
| DEN | |
| LV | |
| BUF | |
| MIA | |
| NYJ | |
| NE |
import { STANDINGS, type Standing } from "@sportsdataverse/examples/data";
import { defineTable } from "@sportsdataverse/sdvtables";
import { renderHTMLAsync } from "@sportsdataverse/sdvtables/html";

// tooltip: true on any column writes the cell's value as its title attribute, which the browser shows on hover: here
// the exact net EPA behind each bar. No tooltip library is loaded.
const spec = defineTable<Standing>()
  .columns((c) => [
    c.text("team"),
    c.dataBar("net_epa", {
      label: "Net EPA/play",
      textPosition: "none",
      numberFormat: { digits: 3 },
      tooltip: true,
    }),
  ])
  .title("AFC, 2024: hover a bar")
  .build();
await renderHTMLAsync(spec, STANDINGS);
In-cell charts
reactablefmtr draws sparklines and sparkbars with the dataui htmlwidget and gauges with nested divs. sdvtables draws
all three as an inline <svg role="img"> per cell, with no script: each has an aria-label and a <title> (the
browser's tooltip) summarising its values, the minimum, maximum and last for a series, plus the reference line and band
when drawn. sparkline and sparkbar read an array column, one array of numbers per row; a null, NaN or infinite
entry is a gap and a missing or empty array leaves the cell blank. Like the other formatters, team and league (or
colorRef) colour each row; a team colour is checked for 3:1 contrast against the table's background and gives way to
the team's other colour, or a blend of it, when it would not show. The weekly series come from
AFC_WEEKS_2024.
Sparklines
sparkline (reactablefmtr react_sparkline) joins the points with straight segments; a gap breaks the line and a
point with gaps on both sides draws as a dot. highlightPoints marks the first, last, min or max point (or
all): a list of names draws them red, or give a colour per name, as reactablefmtr's highlight_points(min = "red").
statline draws a dashed line at the series' mean, median, min or max, labelled at its right end. The chart is
chartWidth by chartHeight pixels (100 by 22); columns are not sortable by default.
| Team | Margin, weeks 1-18 |
|---|---|
| KC | |
| LAC | |
| DEN | |
| LV | |
| BUF | |
| MIA | |
| NYJ | |
| NE |
import { AFC_WEEKS_2024, type AfcWeeks } from "@sportsdataverse/examples/data";
import { defineTable } from "@sportsdataverse/sdvtables";
import { renderHTMLAsync } from "@sportsdataverse/sdvtables/html";

// reactablefmtr react_sparkline: one line per row from an array column. team + league colour each line (checked for
// contrast on the table's background); the bye week is a gap, the worst and best weeks are marked, and the dashed
// statline sits at the team's mean margin. Hover a chart for its summary.
const spec = defineTable<AfcWeeks>()
  .columns((c) => [
    c.text("team"),
    c.sparkline("margins", {
      label: "Margin, weeks 1-18",
      team: "team",
      league: "nfl",
      highlightPoints: { min: "#C84630", max: "#3D8B6E" },
      pointSize: 2,
      statline: "mean",
      chartWidth: 180,
    }),
  ])
  .title("AFC, 2024")
  .build();
await renderHTMLAsync(spec, AFC_WEEKS_2024);
Areas, bands and labels
showArea fills under each unbroken run of points, bandline shades the innerquartiles (R's type 7 quantiles, as
dataui) or the whole range, and labels prints the values of the named points in the cell's text colour: first and
last alone sit beside their points, any other set above them, and the default 22-pixel height grows to make room as
in reactablefmtr. minValue and maxValue put every row on one scale; build() rejects a minValue that is not
below maxValue.
| Team | Margin, weeks 1-18 |
|---|---|
| KC | |
| LAC | |
| DEN | |
| LV | |
| BUF | |
| MIA | |
| NYJ | |
| NE |
import { AFC_WEEKS_2024, type AfcWeeks } from "@sportsdataverse/examples/data";
import { defineTable } from "@sportsdataverse/sdvtables";
import { renderHTMLAsync } from "@sportsdataverse/sdvtables/html";

// showArea fills under each unbroken run of weeks (the bye splits it); bandline shades the inner quartiles of the
// team's margins, statline marks the median, and labels prints the first and last weeks beside their points.
const spec = defineTable<AfcWeeks>()
  .columns((c) => [
    c.text("team"),
    c.sparkline("margins", {
      label: "Margin, weeks 1-18",
      lineColor: "#15607A",
      showArea: true,
      bandline: "innerquartiles",
      bandlineColor: "#15607A",
      statline: "median",
      labels: ["first", "last"],
      chartWidth: 220,
    }),
  ])
  .title("AFC, 2024")
  .build();
await renderHTMLAsync(spec, AFC_WEEKS_2024);
Sparkbars
sparkbar (reactablefmtr react_sparkbar) draws a bar per value standing on zero, so a negative value hangs below
it and the smallest positive bar still shows (dataui's did not). It takes the sparkline's statline, bandline,
labels and bounds, and highlightBars recolours bars the way highlightPoints marks points.
| Team | Points, weeks 1-18 |
|---|---|
| KC | |
| LAC | |
| DEN | |
| LV | |
| BUF | |
| MIA | |
| NYJ | |
| NE |
import { AFC_WEEKS_2024, type AfcWeeks } from "@sportsdataverse/examples/data";
import { defineTable } from "@sportsdataverse/sdvtables";
import { renderHTMLAsync } from "@sportsdataverse/sdvtables/html";

// reactablefmtr react_sparkbar: a bar per week standing on zero; the bye leaves an empty slot. highlightBars recolours
// the best week, labels prints its value above the bar, and the table's text colour draws the label.
const spec = defineTable<AfcWeeks>()
  .columns((c) => [
    c.text("team"),
    c.sparkbar("points", {
      label: "Points, weeks 1-18",
      highlightBars: { max: "#FA8C00" },
      labels: ["max"],
      chartWidth: 180,
    }),
  ])
  .title("AFC, 2024")
  .build();
await renderHTMLAsync(spec, AFC_WEEKS_2024);
Gauges
gauge (reactablefmtr gauge_chart) fills a half circle from minValue (0) to maxValue (by default the column's
largest absolute value). As in reactablefmtr the gauge fills by the absolute value, so -5 fills as far as 5; the printed
number keeps its sign and the aria-label says the absolute value was gauged. Several fill colours ramp over the
column's range (bias as in grDevices::colorRamp), showMinMax prints the scale's ends, size: 2 doubles the
50-pixel gauge, and numberFormat prints the value. A missing or infinite value is blank and text passes through.
| Team | Wins | Points for |
|---|---|---|
| KC | ||
| LAC | ||
| DEN | ||
| LV | ||
| BUF | ||
| MIA | ||
| NYJ | ||
| NE |
import { STANDINGS, type Standing } from "@sportsdataverse/examples/data";
import { defineTable } from "@sportsdataverse/sdvtables";
import { renderHTMLAsync } from "@sportsdataverse/sdvtables/html";

// reactablefmtr gauge_chart: the arc fills |value| of the way from minValue (0) to maxValue (here a 17-game season;
// by default the column's largest value). team + league colour each gauge; showMinMax prints the scale's ends.
const spec = defineTable<Standing>()
  .columns((c) => [
    c.text("team"),
    c.gauge("wins", {
      label: "Wins",
      team: "team",
      league: "nfl",
      maxValue: 17,
      showMinMax: true,
      boldText: true,
    }),
    c.gauge("pf", { label: "Points for", fill: ["#C84630", "#EDE0CC", "#3D8B6E"], minValue: 250 }),
  ])
  .title("AFC, 2024")
  .build();
await renderHTMLAsync(spec, STANDINGS);