MUI X Data Grid
MUI X Data Grid (@mui/x-data-grid) is Material UI's React data grid: sorting,
filtering, column menus and keyboard navigation over rows you hand it. @sportsdataverse/sdvtables/mui turns an
sdvtables spec into a <DataGrid>'s props, so the same spec that renders a static HTML table also drives a grid, with
its number formats, logos, headshots, team colours and theme. Only the MIT community package is used: nothing here needs
@mui/x-data-grid-pro or @mui/x-data-grid-premium, and none of their features (row grouping, aggregation, column
pinning, Excel export) is mapped.
The subpath never imports MUI. It returns plain props whose types only match MUI's shapes (checked against MUI's own
types), and builds its images with React's createElement, so it also renders on the server. @mui/x-data-grid is an
optional peer, 9.15.0 or later but below 10 (the adapter styles v9's grid); these examples run 9.15.0 with @mui/material 9.5.0. MUI's own peers
(@mui/material, @mui/system, @emotion/react and @emotion/styled) are your app's, as for any MUI component. Each
grid below is drawn by MUI in your browser.
A spec as grid props
dataGridProps(spec, rows) returns columns, getRowId, getRowClassName, sx, density and rowHeight: spread
them onto the grid next to rows. It is synchronous, so first await prepare(spec) from
@sportsdataverse/sdvtables/html, which loads the leagues the logo and team colour columns need. prepare reads only the
spec, so when teamRows names a league no column uses (a plain text team column, say), also
await loadLeague(league) from @sportsdataverse/sdvplot first. The images and colours
are worked out once, from the rows you pass, so build the props again (or useMemo them on rows) when the rows
change. Your own grid props (autoHeight, initialState, pageSizeOptions, checkboxSelection and the rest) go next
to them as usual.
Each spec column becomes one GridColDef, with the label and alignment the HTML table gives it. A width in px becomes
MUI's numeric width; a width in other units (a percentage, say) is left to MUI, with one warning. num, int, pct
and rank columns keep sdvtables' formats through valueFormatter (grouped thousands, fixed decimals, a forced sign,
U+2212 minus signs, ordinals with a superscript suffix) and filter as numbers. A scaleNote divides its num and int
columns and suffixes their labels exactly as in the HTML table. sortable and filterable pass through, and a column's
subheader becomes its header tooltip. A blank or unparseable value in a number column is missing: an empty cell, never
"NaN" or 0.
Sorting is sdvtables' own, through MUI's getSortComparator: a column's compare if it has one, else numbers for the
numeric kinds and text otherwise, with missing values last whether you sort ascending or descending, as in the
interactive HTML table. (MUI's own number sort would put them first when ascending.)
getRowId reads the spec's rowKey when it has one, and otherwise numbers the rows in the order you passed them; set a
rowKey when the rows change after the props are built. MUI needs a unique id per row, so dataGridProps throws when two
rows share a rowKey value, when a row's rowKey value is blank, or, with no rowKey, when the same row object appears
twice.
Logos and team-coloured rows
logo and wordmark columns draw the team's image in the cell, height px tall, through MUI's renderCell; with
includeName the name follows the logo. The team can be an abbreviation, a name or a numeric id, as a number or as a
string, as everywhere in sdvtables. A team with no image in the archive, or one that is not found, keeps its text, and
warns once, as the HTML table does. rowHeight grows so the tallest image fits the theme's density.
teamRows: { key, league } fills each row with its team's colour. The colours are sdvplot's team palette for the
theme's background, the same teamColorPalette that @sportsdataverse/sdvplot/mui gives MUI X Charts, so a team keeps
3:1 contrast against the grid and stays distinct from the teams before it. Each colour is laid over the background at
alpha (0.4 by default, as the teamColorBg column), and the row's text turns black or white, whichever reads better on
that fill. A hovered or selected team row keeps a slightly deeper shade of its fill, its text worked out again, rather
than MUI's grey. teamColorBg and teamColorBar columns colour a single cell the same way, through MUI's
cellClassName.
The grid below is the sample AFC standings on the sdv theme, sorted by wins.
 KC
 BUF
 LAC
 DEN
 MIA
 NYJ
 LV
 NE
import { DataGrid } from "@mui/x-data-grid";
import { STANDINGS, type Standing } from "@sportsdataverse/examples/data";
import { defineTable } from "@sportsdataverse/sdvtables";
import { fontsLinkFor, prepare } from "@sportsdataverse/sdvtables/html";
import { dataGridProps } from "@sportsdataverse/sdvtables/mui";
import { useEffect } from "react";

// the eight AFC East and West teams of the sample standings, each row filled with its team's colour
const spec = defineTable<Standing>()
  .columns((c) => [
    c.logo("team", { league: "nfl", label: "Team", includeName: true, height: 28, width: "120px" }),
    c.text("division", { width: "90px" }),
    c.int("wins", { label: "W", width: "56px" }),
    c.int("losses", { label: "L", width: "56px" }),
    c.int("pf", { label: "PF", width: "64px" }),
    c.int("pa", { label: "PA", width: "64px" }),
    c.num("net_epa", { label: "Net EPA/play", digits: 3, forceSign: true, width: "120px" }),
  ])
  .theme("sdv")
  .rowKey("team")
  .build();
await prepare(spec);
const props = dataGridProps(spec, STANDINGS, { teamRows: { key: "team", league: "nfl" } });

function Standings() {
  // the theme's fonts: the page <head> carries the link fontsLinkFor returns
  useEffect(() => document.head.insertAdjacentHTML("beforeend", fontsLinkFor(spec)), []);
  return (
    <div style={{ width: "100%", maxWidth: 820 }}>
      <DataGrid
        rows={STANDINGS}
        {...props}
        autoHeight
        hideFooter
        disableRowSelectionOnClick
        initialState={{ sorting: { sortModel: [{ field: "wins", sort: "desc" }] } }}
      />
    </div>
  );
}
<Standings />;
Headshots
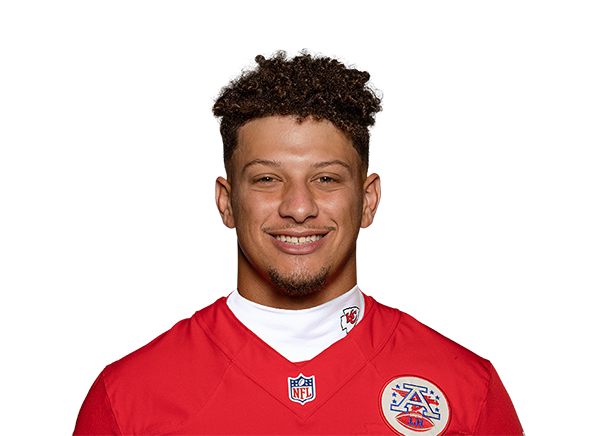
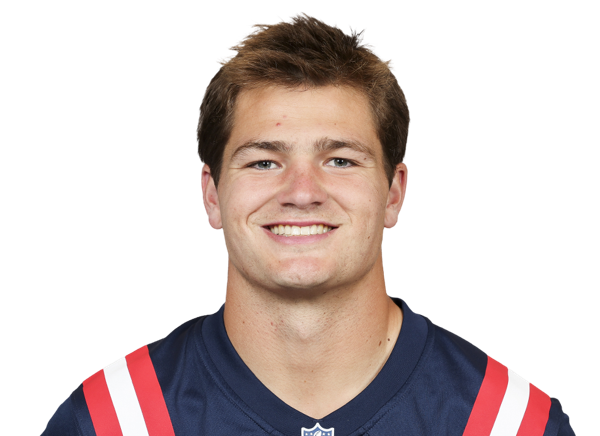
headshot columns draw ESPN player headshots from the cell's ESPN athlete id, or from an nflverse gsis id with
idSystem: "gsis" (prepare loads the gsis map). An id with no headshot keeps the id as text and warns once. A
headshot has an empty alt: it is decorative, as the player's name belongs in a column of its own beside it. This
leaderboard is on the booktabs theme, with each quarterback's team as a teamColorBar cell, sorted by net EPA per
play; New England's value is blank in the sample data, so it sorts last.






import { DataGrid } from "@mui/x-data-grid";
import { STANDINGS, type Standing } from "@sportsdataverse/examples/data";
import { defineTable } from "@sportsdataverse/sdvtables";
import { fontsLinkFor, prepare } from "@sportsdataverse/sdvtables/html";
import { dataGridProps } from "@sportsdataverse/sdvtables/mui";
import { useEffect } from "react";

// each team's most frequent 2024 starter, by ESPN athlete id; New England's net EPA is blanked in the sample data
const spec = defineTable<Standing>()
  .columns((c) => [
    c.headshot("qb_espn_id", { league: "nfl", label: "", height: 44, sortable: false, width: "72px" }),
    c.text("qb", { label: "Quarterback", width: "170px" }),
    // the team's abbreviation, edged in its colour
    c.teamColorBar("team", { league: "nfl", label: "Team", barWidth: 5 }),
    c.int("wins", { label: "Team wins" }),
    c.num("net_epa", { label: "Net EPA/play", digits: 3, forceSign: true, width: "130px" }),
  ])
  .theme("booktabs")
  .rowKey("qb_espn_id")
  .build();
await prepare(spec);
const props = dataGridProps(spec, STANDINGS);

function Leaderboard() {
  useEffect(() => document.head.insertAdjacentHTML("beforeend", fontsLinkFor(spec)), []);
  return (
    <div style={{ width: "100%", maxWidth: 680 }}>
      <DataGrid
        rows={STANDINGS}
        {...props}
        autoHeight
        hideFooter
        disableRowSelectionOnClick
        initialState={{ sorting: { sortModel: [{ field: "net_epa", sort: "desc" }] } }}
      />
    </div>
  );
}
<Leaderboard />;
Themes, dark ones included
The theme's tokens become the grid's sx. Its background, text, muted text, rule and header colours and its body font
set MUI's own CSS variables (--DataGrid-t-color-background-base and the rest), written on a doubled class so they win
over MUI's defaults without a ThemeProvider. The header title takes the theme's label font, weight, size, case and
tracking; a theme with stripes stripes odd rows through getRowClassName. Density follows the theme: compact is MUI's
compact, comfortable MUI's standard and social MUI's comfortable.
A dark theme such as midnight needs nothing more: the grid takes its dark background and light text, and team rows
take the palette for that dark background, so a navy team lightens until it reads. MUI's own Material pieces that sit
inside the grid (the pager, icon buttons) take the grid's text colour. Menus and panels that MUI opens in a portal sit
outside the grid, so for a fully dark grid wrap it in a dark ThemeProvider as well. This grid keys its rows by
stats.nba.com's numeric team id, which resolves to each team's logo and colour.





import { DataGrid } from "@mui/x-data-grid";
import { NBA_STANDINGS } from "@sportsdataverse/examples/data";
import { defineTable } from "@sportsdataverse/sdvtables";
import { fontsLinkFor, prepare } from "@sportsdataverse/sdvtables/html";
import { dataGridProps } from "@sportsdataverse/sdvtables/mui";
import { useEffect } from "react";

// the five Pacific rows, keyed by stats.nba.com's numeric TeamID: the logos and row colours resolve from the number
const rows = NBA_STANDINGS.map((s) => ({
  team_id: s.team_id,
  name: `${s.city} ${s.team}`,
  wins: s.wins,
  losses: s.losses,
  win_pct: s.wins / (s.wins + s.losses),
  division_rank: s.division_rank,
}));
type Row = (typeof rows)[number];
const spec = defineTable<Row>()
  .columns((c) => [
    c.rank("division_rank", { label: "Rank", width: "80px" }),
    c.logo("team_id", { league: "nba", label: "", height: 32, sortable: false, width: "64px" }),
    c.text("name", { label: "Team", width: "190px" }),
    c.int("wins", { label: "W" }),
    c.int("losses", { label: "L" }),
    c.pct("win_pct", { label: "Win %", digits: 1, scale: true }),
  ])
  .theme("midnight")
  .rowKey("team_id")
  .build();
await prepare(spec);
const props = dataGridProps(spec, rows, { teamRows: { key: "team_id", league: "nba", alpha: 0.3 } });

function Pacific() {
  useEffect(() => document.head.insertAdjacentHTML("beforeend", fontsLinkFor(spec)), []);
  return (
    <div style={{ width: "100%", maxWidth: 700, background: "#0C0D10", padding: 12 }}>
      <DataGrid rows={rows} {...props} autoHeight hideFooter disableRowSelectionOnClick />
    </div>
  );
}
<Pacific />;
The themes name their fonts but do not load them: put the <link> that fontsLinkFor(spec) returns in the page's
<head>, as these examples do.
What is not mapped
The cell kinds that draw in HTML or SVG (pills, bars, sparklines, gauges, icons and the rest) show their plain value in
the grid, with one warning per kind; render those tables with renderHTML or <SdvTable> instead. Decorations
(titles, source notes, spotlights, legends) are the page's to add around the grid; a scaleNote scales its columns and
labels, but its note is yours to place. Logos are plain <img> tags, so the
grid's own CSV export and print keep the text, not the images.
Testing and server rendering
Each image carries data-sdv-id (the team or player id) and data-sdv-kind (logo, wordmark or headshot), so a
test can read back which images a grid drew and in which rows. The props are plain values and functions: build them in
a client component, once the league has loaded, as MUI's grid is a client component itself.
In the gallery: MUI X Data Grid.